Untitled
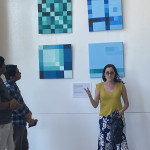
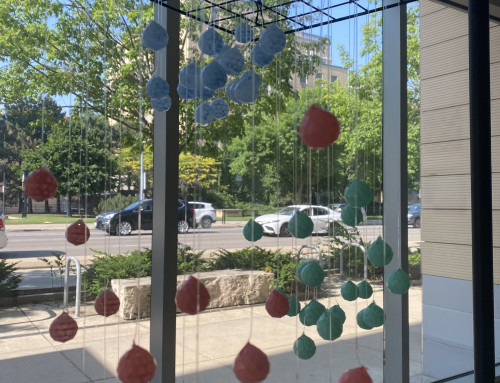
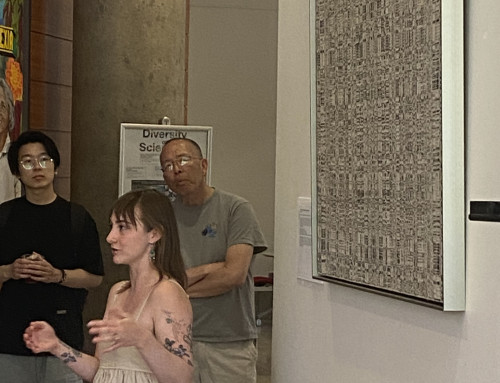
 The Visual Reasoning Lab aims to understand how people infer meaning about visualizations. To this end, we often ask participants in our experiments to make judgments about images of colormap visualizations, like the paintings displayed here. We typically create these colormaps by linearly interpolating two endpoint colors and using the resulting color scales on fake datasets. The colormaps painted here, however, are visualizations of real data submitted by members of the Wisconsin Institute for Discovery. Below each colormap is a brief description of the data represented in it.

About the artist: Clementine Zimnicki is a 3rd year graduate student working with Karen Schloss. She is interested in people’s expectations about the meanings of colors in visualizations, and how the shape and spatial configuration of data can impact these expectations. She has always thought of her experimental stimuli as artworks, and is thrilled to have been able to display them as art.


